Stress-free investing
Stay objective and make confident decisions when it matters the most by sticking to your personal Risk Strategy.
Charles Ottosen

BTC drops... check the risk metric... all good, and the decision to buy or not is made. Feels good!
Chuck
"I love having this tool to help make decisions and cut out FOMO and FUD."
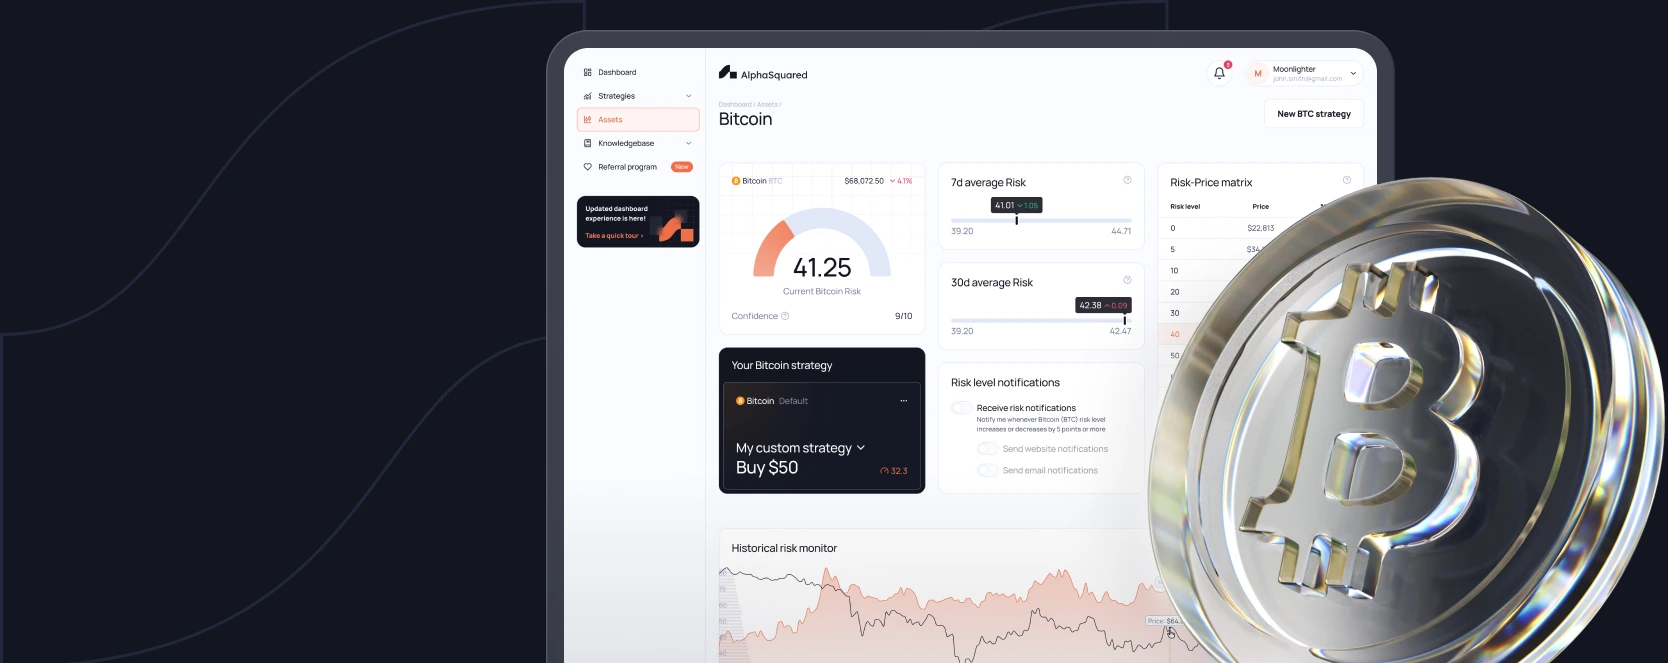
What is risk?
A score between 0 and 100 representing the market’s pulse.
Computed by machine learning, our Risk Model distills vast
market data into an easy-to-understand score for Bitcoin and other assets.
Note! We do not retrofit any data. BTC Risk levels calculated daily since 2021 remain unaltered historically.
Key benefits of AlphaSquared
Clarity
Effortless and objective - Let our Risk Model do all the heavy lifting
Performance
The risk-adjusted DCA strategy is proven to outperform regular DCA since 2021
Confidence
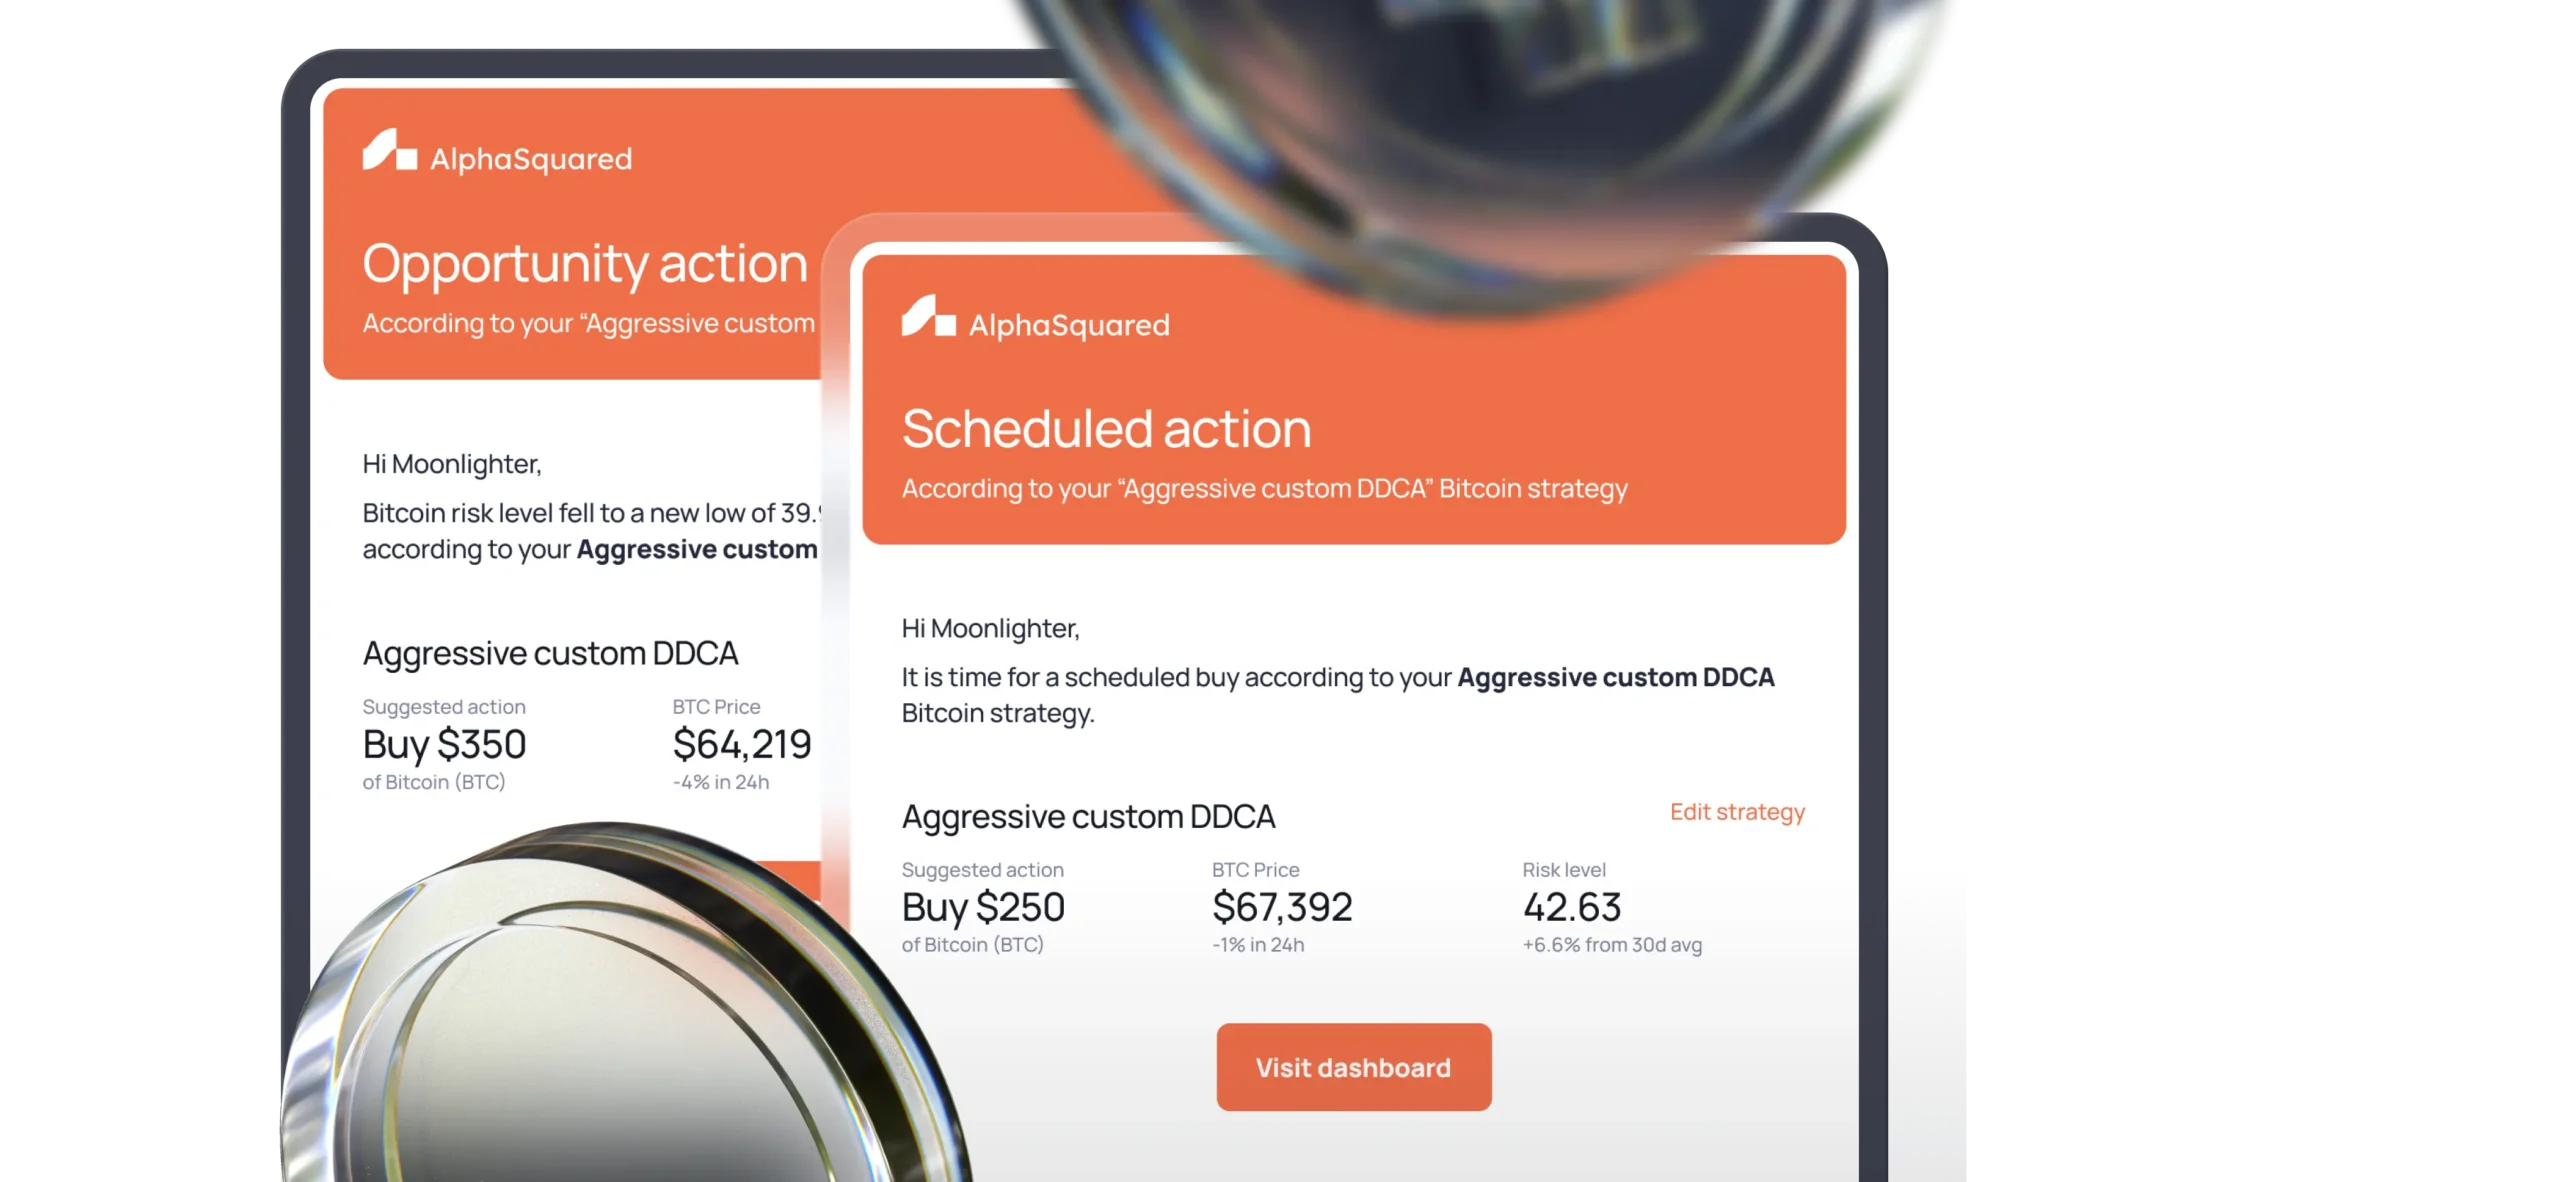
Should I take profits? Stay confident with Risk-adjusted DCA and Risk-alerts
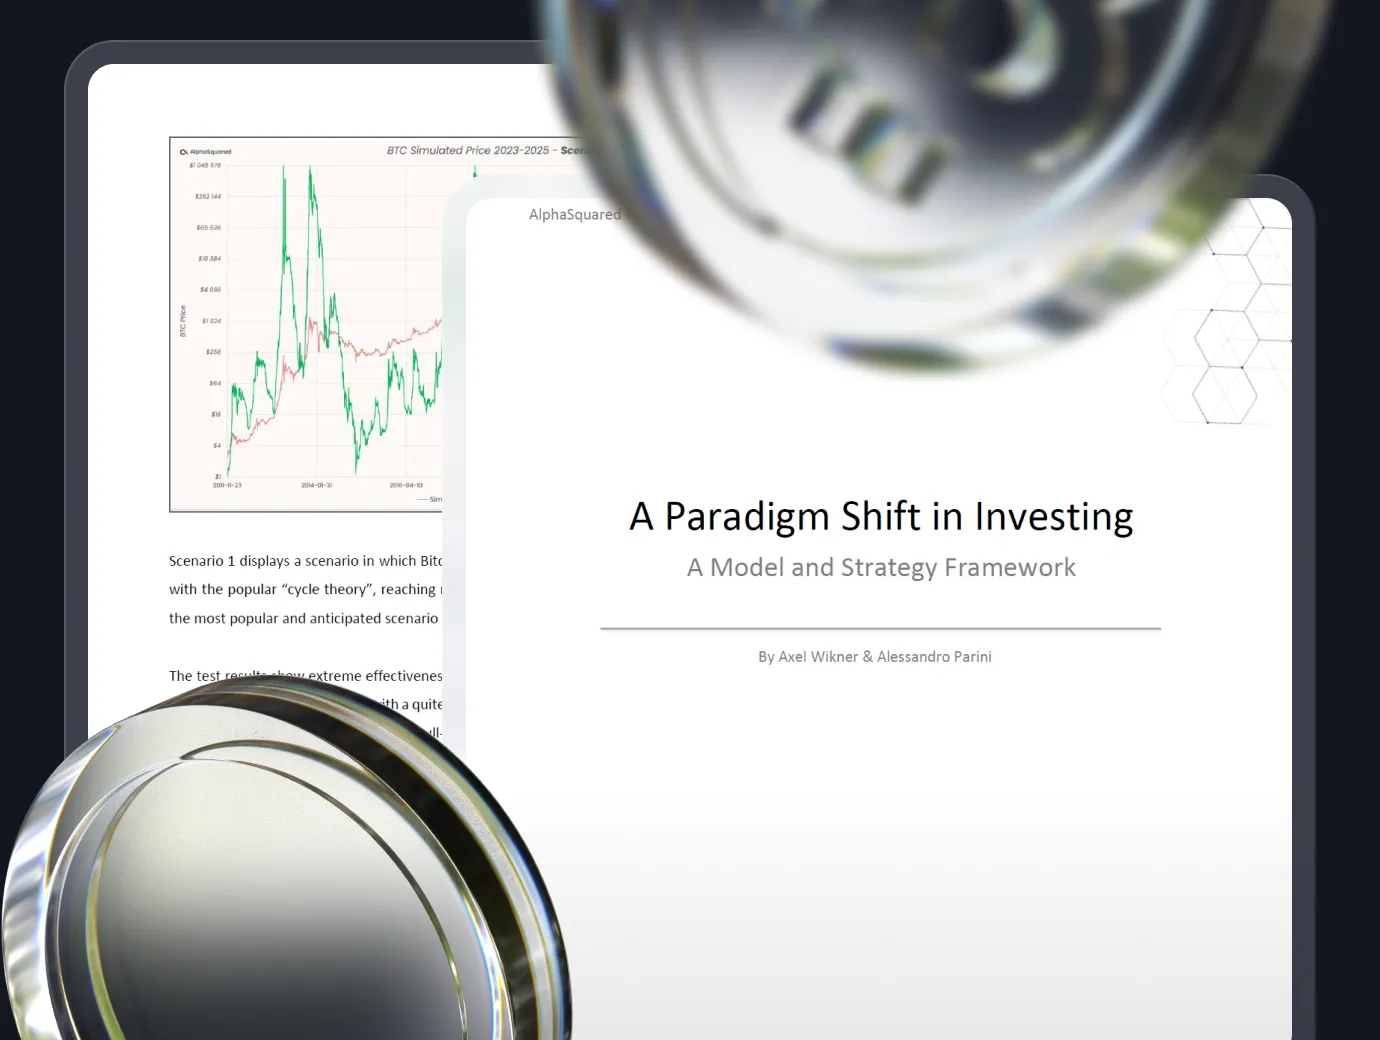
The minds behind
Initially, the Risk Model was in our private toolbox. What began as an experiment in exploiting risk identification, rather than predicting prices, yielded impressive results.
Seeing the potential for a much wider application in finance than we initially anticipated, we felt compelled to share it with the world.

Alessandro Parini
Economist
University of Basel
Co-founder

Axel Wikner
BA & Data Scientist
NTNU
Co-founder
The Risk Model

Real-time calculation & notifications
Analyzed and trained on price,
sentiment, volatility, on chain, macroeconomics,
black swan events, and more
Stress-tested of hundreds on potential market
scenarios using simulations
Proven track record since 2021
Get started for free
Try for free
"The BTC Risk Metric alone has easily paid for the lifetime membership 100 times over."
Free trial
Free trial includes
Risk Models
Access to BTC, ETH, SOL and many more.
Risk Notifications
Get notified of risk level changes
Strategy Backtesting
Test with historic data
API Access
Access live risk levels
No strings attached
No credit card or personal info required
Yearly plan
17% total savingsPlan includes
Risk Models
Access to BTC, ETH, SOL and many more.
Risk Notifications
Get notified of risk level changes
Strategy Backtesting
Test with historic data
API Access
Access live risk levels
Lifetime Plan
Lifetime plan includes
Risk Models
Access to BTC, ETH, SOL and many more.
Risk Notifications
Get notified of risk level changes
Strategy Backtesting
Test with historic data
API Access
Access live risk levels
Lifetime Access
Single payment, lifetime benefits.